AgriTech Analytics Herd Reports
Click on the thumbnail image to the side of each description to view a PDF sample of each report.
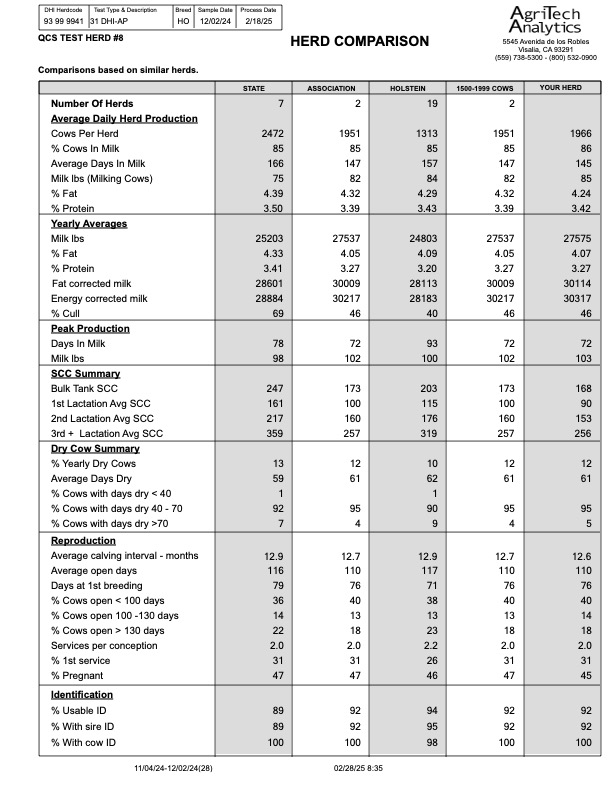
Herd Comparison
The Herd Comparison report provides a valuable summary of information on your herd in the areas of Daily Production, Yearly Production, Peak Production, SCC Summaries, Dry Cow Summaries, Reproduction Summaries and Herd Identification Data. This data is compared to data from herds with the same breed, herd size, from your local DHI association and the state. This one page report is extremely useful in determining areas that may require management attention.
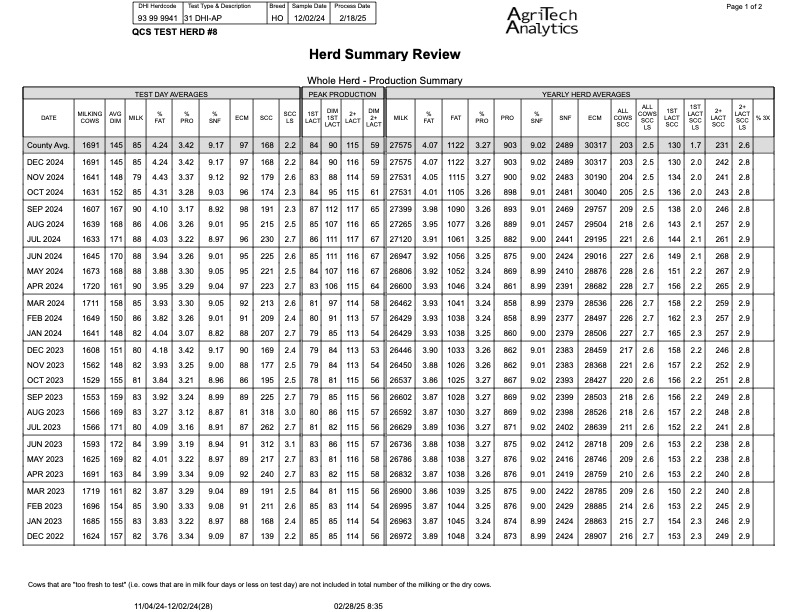
Herd Summary Review
The Herd Summary Review contains herd management information for the past 25 months. Sections feature test day averages, peak production, yearly averages, inventory, reproduction, and dry cow data as well as a culling history. It allows the producer to view changes or seasonal patterns in the herd over the past two years. This review allows the manager to evaluate trends within the herd. The Current County Average is also displayed for comparison purposes.
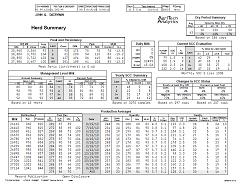
Herd Summary
The Herd Summary features sections entitled Herd Summary and Consultant Summary. The Herd Summary highlights production data including annual averages of the herd as well as peak and persistency data, management level milk and somatic cell data by lactation groups. The Consultant Summary section of the report focuses on the herd genetic profile, the number of cows entering and leaving the herd, and herd turnover, in addition to a herd inventory and reproduction summary.
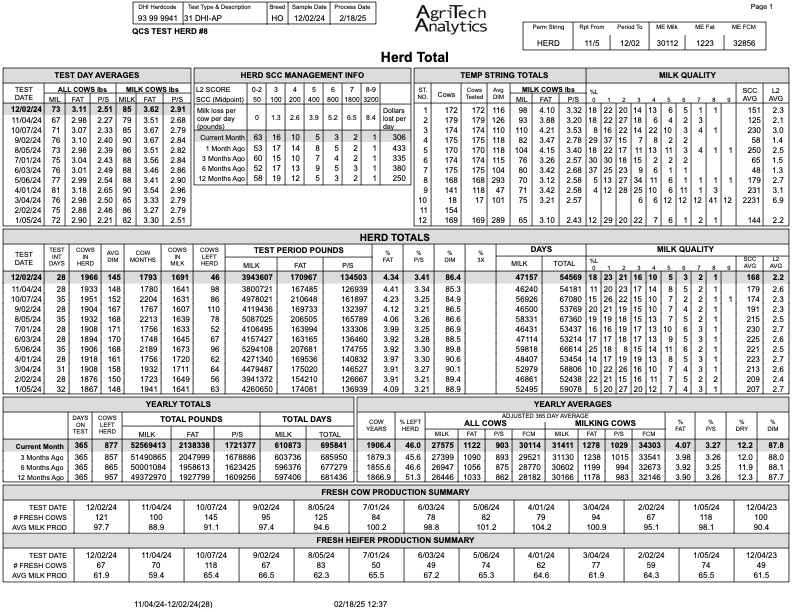
Herd Total
The Herd Total Report is a flagship report of the AgriTech Analytics processing center. While similar to a traditional Herd Summary, it provides production data for each test day of the past year in addition to annual totals. Unique to this report is the Fresh Cow and Fresh Heifer Production Summary. Featured on this report are various tables broken out by lactation groups. These tables include an analysis of 305 day/mature equivalent production, milk quality, reproductive statistics as well as cow, sire and service sire PTAs.
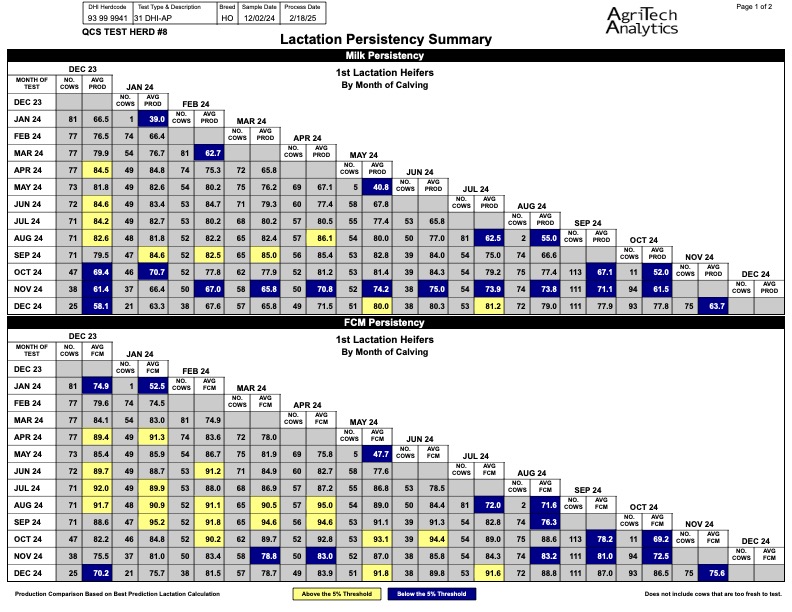
Lactation Persistency
Lactation persistency refers to the degree with which the rate of production is maintained as a group of animal progress through their lactation. The Lactation Persistency report separates the animals into twelve groups based upon the month of calving. Using the Best Prediction method of calculating lactation records, it highlights groups of animals that are performing either better or not as well as expected. This report is very helpful in spotting trends within the herd as the report can track cohort group in a number of ways. The Lactation Persistency report is divided by lactation groups and can be evaluated based on fat corrected milk (FCM), energy corrected milk (ECM), milk yield, or pounds of fat.
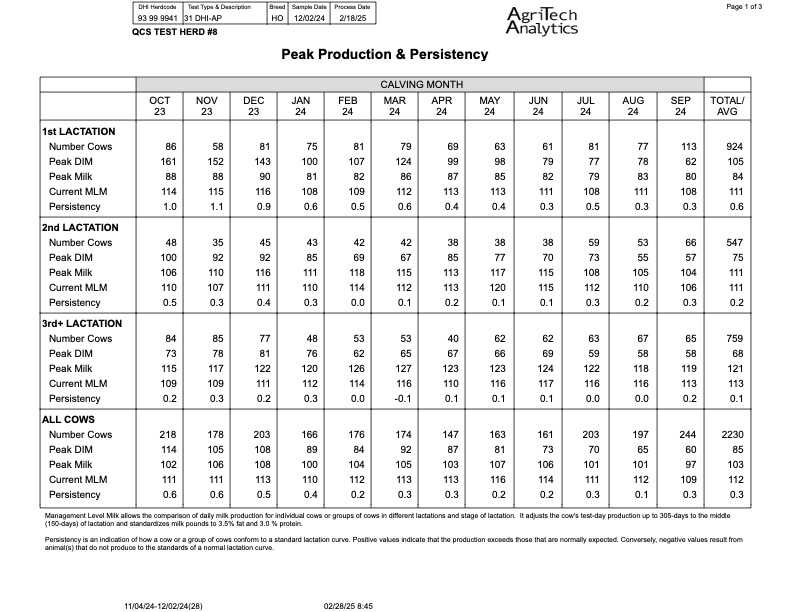
Peak Production and Persistency
This summary features data regarding the Peak Production and Persistency of each lactation group as well as the overall herd. This information is divided by month of calving and indicates the number of cows in each category as well as that group’s pounds of milk and days in milk at peak in addition to the group’s management level milk and persistency. Data is displayed in both tabular and graphical formats. Cows that peak higher and have higher levels of persistency are typically the most profitable cows.
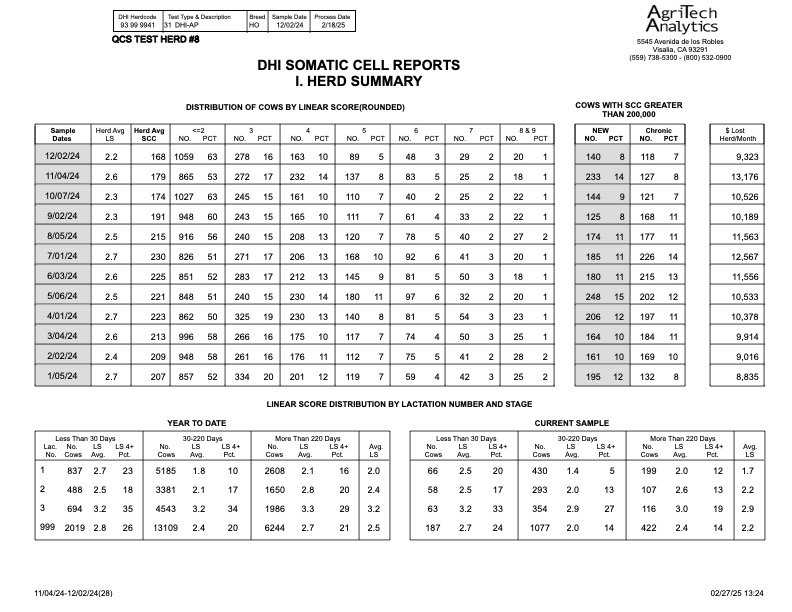
SCC Herd Summary
The SCC Herd Summary provides an analysis of your herd’s somatic cell count status over the last twelve tests, year to date, and current sample day. Breakouts of the data include the number and percent of cows by L2 score, the number and percent of new and chronically infected cows along with the dollar value of loss production attributed to high somatic cell counts. An additional feature of this report is SCC hotlist that includes the high SCC cows with the percent of the herd SCC.
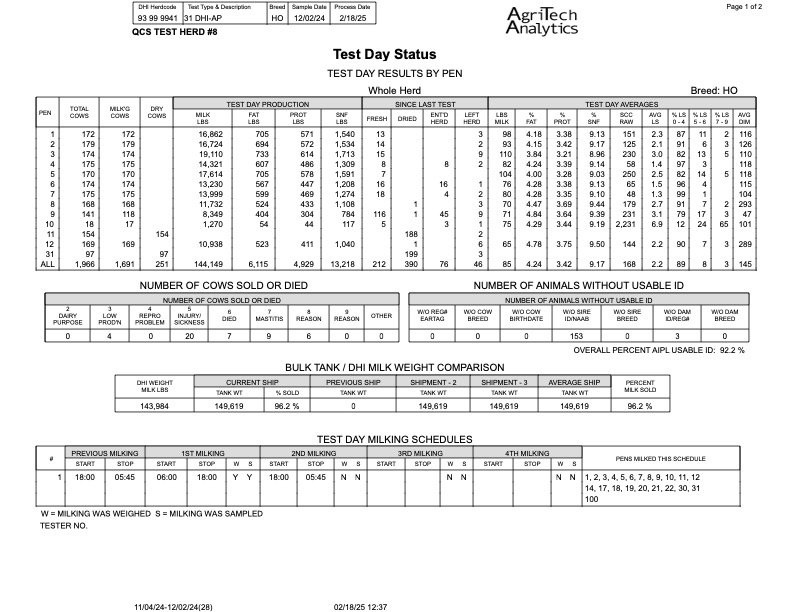
Test Day Status
The Test Day Status report is intended to be a review of what occurred on test day and within the last test interval. Featured sections include test day results by pen, number of cows leaving the herd, current identification summary, milk shipped comparison, and test day milking schedules. The previous 13 test day totals and annual average production is also displayed.
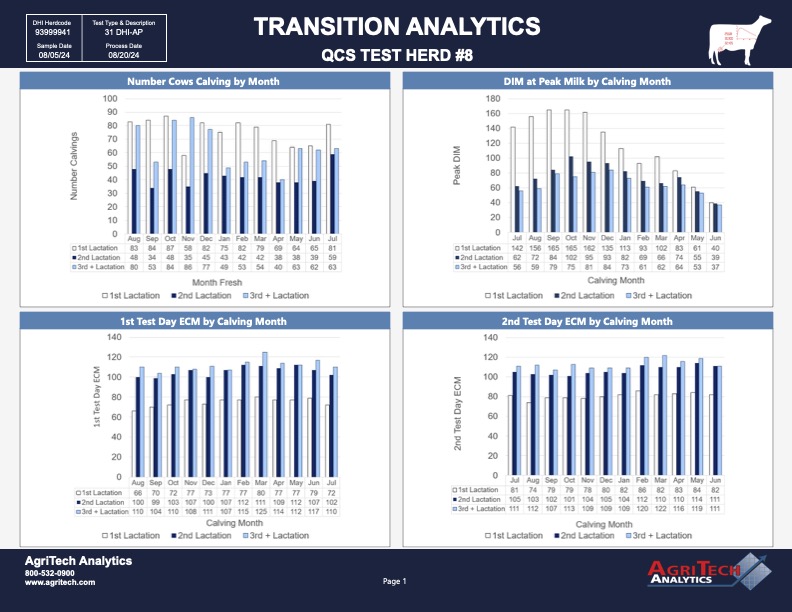
Transition Analytics
The Transition Analytics Report is a series of graphs and charts that provide a herd level view of several metrics considered key to the transition period. The purpose is to show herd-level trends and allows producers to quickly identify areas of concern as well as areas where performance exceeds expectations. Many of the graphs in the report show what’s happening by the month the cows freshened, providing insight into the timing of trends. These graphs can be referenced as a whole to provide corroboration of the data shown, and aid in identifying specific issues that may require attention.
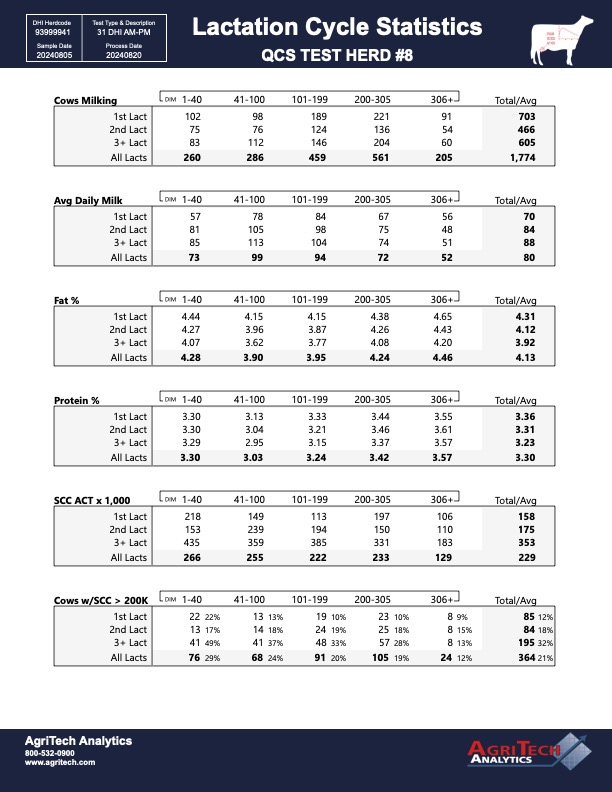
Lactation Cycle Statistics
This is a one-page report that provides an easy-to-read look at your herd’s production by animal groups. Cows are grouped by lactation number and by days in milk, with metrics that include Average Daily Milk, Fat %, Protein %, and SCC above 200,000. Producers can quickly see groups of animals and what they’re contributing to the operation’s top line.
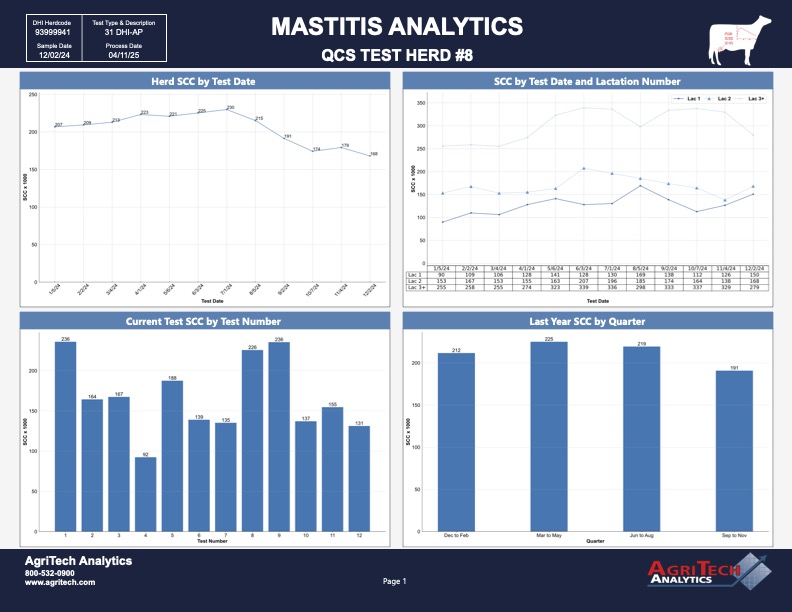
Mastitis Analytics
The Mastitis Analytics Report is a series of graphs and charts that provide many insights into Somatic Cell Counts. Most of these are herd level visuals reported variously by time, lactation group, DIM, or test date. Producers can observe trends in these graphs and drill down into data to identify areas to address. Some scatter graphs show where individual animals place in Somatic Cell Score to provide another overview of herd performance.
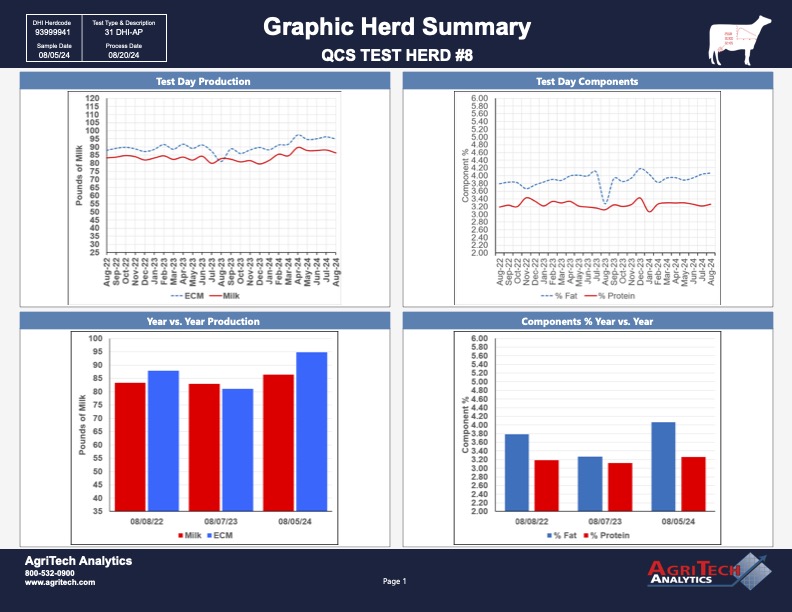
Graphic Herd Summary
The Graphic Herd Summary takes information from our Herd Summary Review and puts it in graph format. This contains herd management information for the past 25 months. Sections feature Test Day averages, peak production, yearly averages, inventory, reproduction, and dry cow data as well as culling history. It shows the producer changes or seasonal patterns over the past two years.